Is your CSAT change real or just noise?
A CSAT change counts as real when it is bigger than normal survey noise. Compare both periods with a two proportion test, and trust the change only when p is under 0.05.
Your support team's CSAT climbed from 75% to 79% after you switched to live chat. Before you credit the switch, check whether that rise is bigger than normal survey noise.
Why a score can move when nothing changed
Each survey hears from only a slice of your customers. Ask a different slice, and the score shifts a little, even with the same service.
The fewer answers you have, the bigger that shift. Here is a score near 68% at three sizes, with the range where the real score most likely sits:
- 40 answers (27 happy): between 52% and 79.9%
- 250 answers (170 happy): between 62% and 73.5%
- 1,500 answers (1,020 happy): between 65.6% and 70.3%
These ranges use the Wilson method at 95% confidence. It is the same math behind the trust range in the GleeMeter calculator.
A four step test for a real change
- Note last period's happy answers and total answers.
- Note this period's happy answers and total answers.
- Type both periods into Question C of the calculator.
- Read the verdict. A p value under 0.05 counts as a real change.
Behind the verdict is a two proportion test. It checks how often a gap of this size would show up by chance alone. The statistics handbook from NIST uses the same test to compare two groups.
Case 1: the live chat switch
In March, 168 of 224 customers were happy. That gives a CSAT of 75%.
In April, after the switch, 187 of 236 customers were happy. That gives a CSAT of 79.2%.
The score rose by 4.2 points. The test gives p = 0.279, which is far above 0.05.
The switch may help, but this data cannot prove it yet. Give it another month or two of answers.
Case 2: a new refund policy
In the first quarter, 612 of 850 customers were happy. That gives a CSAT of 72%.
In the second quarter, with the new refund policy, 702 of 860 were happy. That gives a CSAT of 81.6%.
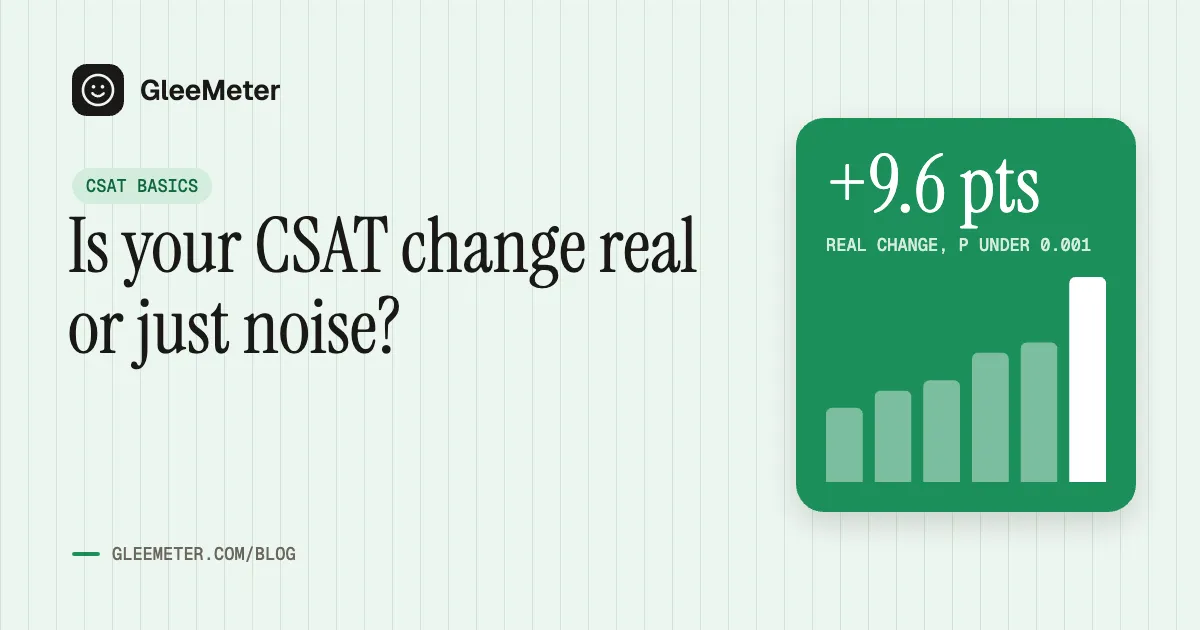
The score rose by 9.6 points. The test gives p under 0.001.
This rise is real. A gap this big would almost never appear by chance.
The same 4 point rise, three different verdicts
Sample size decides whether a change counts. Here is a rise from 82% to 86% at three sizes:
- 50 answers each period (41 happy, then 43 happy): p = 0.585, so this is noise.
- 400 answers each period (328 happy, then 344 happy): p = 0.123, so this is still noise.
- 2,000 answers each period (1,640 happy, then 1,720 happy): p under 0.001, so this change is real.
Smaller teams can still test changes. Compare longer periods, such as one quarter against the next.
Traps that fake a change
- Rewording the survey question, such as "How did we do?" one month and "How satisfied were you?" the next.
- Adding a new channel halfway, such as starting phone surveys in the middle of a period.
- Counting a single bad day, such as an outage that floods one week with unhappy answers.
- Ignoring the season, such as holiday rush weeks against quiet weeks.
- Changing who gets the survey, such as only new customers one month and everyone the next.
How to share the result
Put the score, the change and the verdict in one line. For example:
CSAT rose from 72% to 81.6% this quarter, based on 860 answers. The change test says this rise is real (p under 0.001).
When the test says noise, be just as clear. For example: "CSAT is 79.2%, up from 75%, but the rise is within normal noise. We will check again after May."
Clear lines like these stop false alarms and help leaders act on real wins.
To plan your survey size, read how many CSAT responses you need.
Frequently asked questions
What p value counts as a real CSAT change?
Most teams use 0.05. A p value under 0.05 counts as a real change, and anything above it could be noise.
Can a small team test CSAT changes?
Yes. Compare longer periods, such as a month or a quarter, so each side has more answers.
Is a bigger change always real?
No. A 10 point jump from 20 answers can still be noise. Run the test every time before you report a change.
Keep reading
How many happy answers do you need to reach your CSAT goal?
To reach a CSAT goal, your new answers must score above it. Divide the gap in happy answers by how far new answers beat the goal.
How many survey responses do you need for a reliable CSAT score?
For a CSAT score within 5 points, you need between 139 and 385 answers. The closer your score sits to 50%, the more answers you need.